Maps!
Maps are pretty cool, and not just for navigation.
By creating geographical representations of the places we live, we can establish patterns, identify problems, create solutions, and most of all, learn more about not just where we are, but how and why we live in our respective locations. In that way, every map should tell a story, right?
In that vein, here are 9 maps that help tell that story for Los Angeles. Some useful, some funny, some flat-out informative. Hope you enjoy!
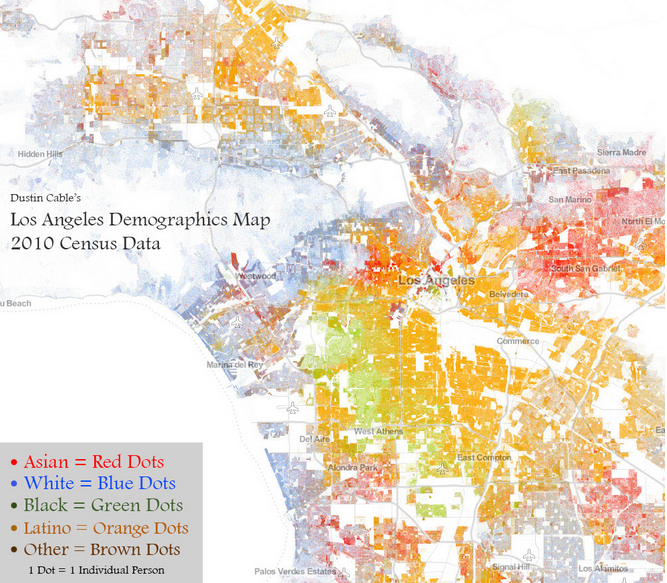
First up, let’s map those racial demos, via the 2010 Los Angeles census.
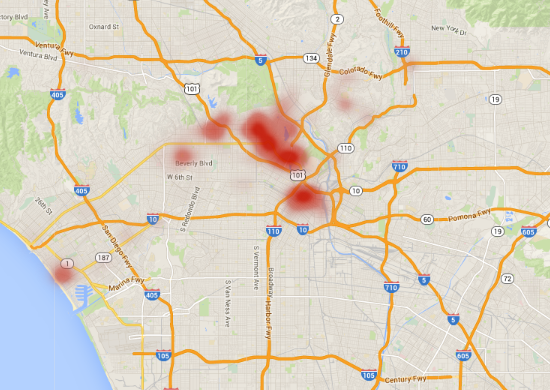
Next up, let’s locate those hipsters. In this case, Yelp has a cool mapping feature that has calculated mentions of “hipster” through certain. A red dot for each mention displays a heavy centralization of hipsters in the Silverlake / Echo Park region with some outliers spread out around Downtown, Venice and a smidgeon in Old Town Pasadena.
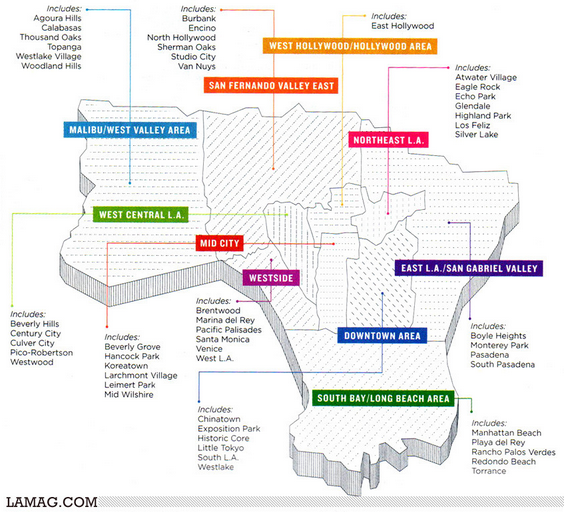
Do you truly know your neighborhoods. Here’s a breakdown of what to call what (the literal version) via LAmag.
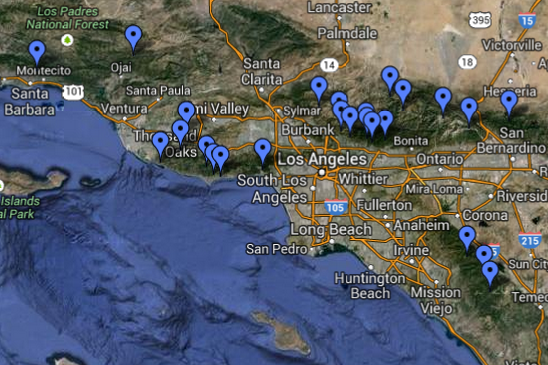
Ok, so you’re looking for some cool nature stuff? How about this map of water falls to be found in and around L.A.
For the interactive version, go here.
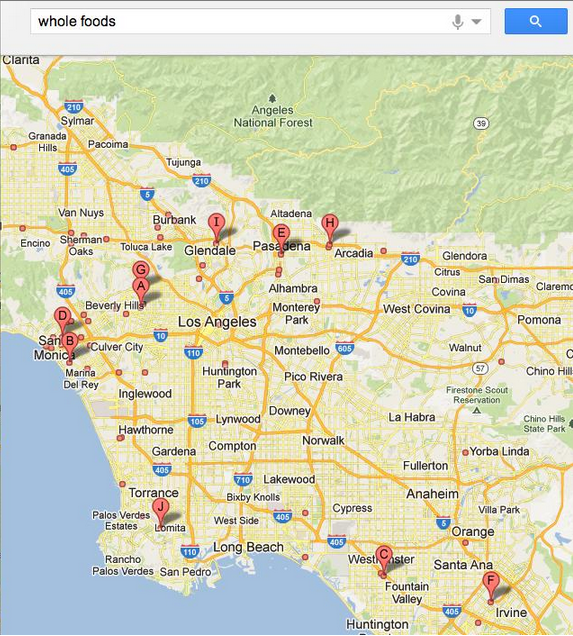
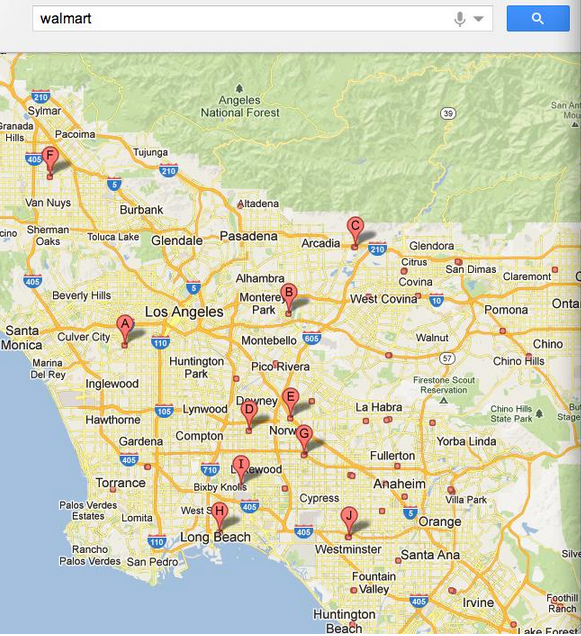
What’s the easiest way to see where the rich people live in L.A.? How about mapping Walmarts vs. Whole Foods. Bam.
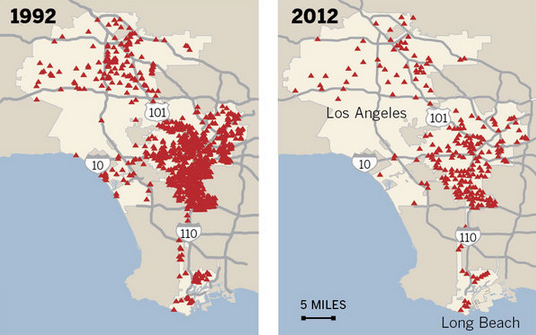
Crime? Here’s a a visual representation of homicides in Los Angeles comparing 1992 to 2012. Interesting how the distribution remained super consistent even as the overall level of homicides scaled down. Yay to less murders!
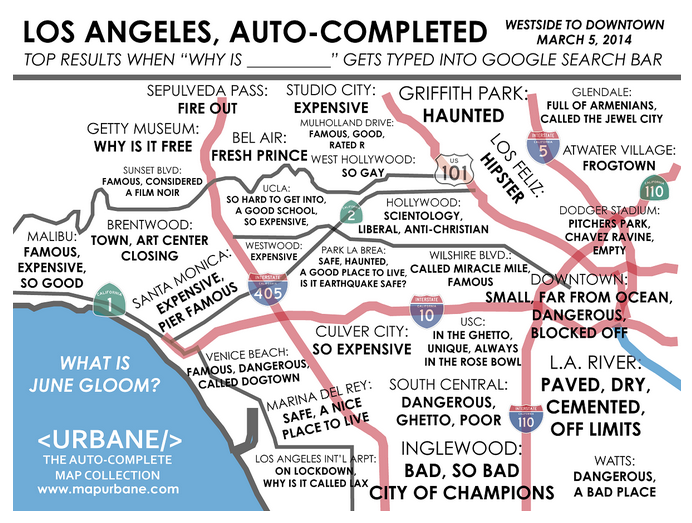
Looking for stereotypes? How about this Google autocomplete map of the westside of L.A. via Map Urbane.
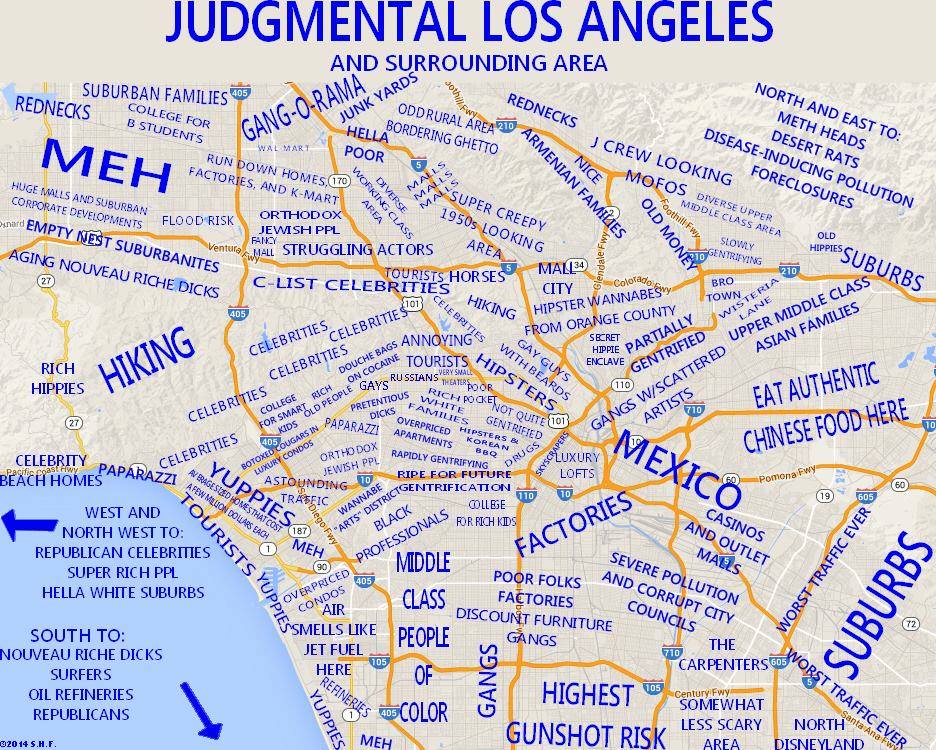
And lastly, since we’re on the subject of stereotypes, here is a judgmental map of Los Angeles (labels not our own). Source here.
Brian is the co-founder of We Like L.A. and a lifelong fan of puns, the Lakers, and late night tacos. Follow him on Twitter @bchampLA

